


The Solution for Monitoring the Deadlock of the Main Thread
In project development, the solution for monitoring the main thread’s lag is particularly important. It plays a guiding role in our subsequent optimization logic, so below we start to discuss the implementation of the solution for monitoring the main thread’s lag.
Basic principles of solution implementation:
Monitor the runloop state changes of the main thread, and then create two sub-threads to monitor the runloop’s beforeWaiting, beforeSources, and afterWaiting state changes. Use semaphores to achieve thread synchronization, and then output the stack information of the lag and the start time and end of the lag. time.
First understand the running logic of runloop: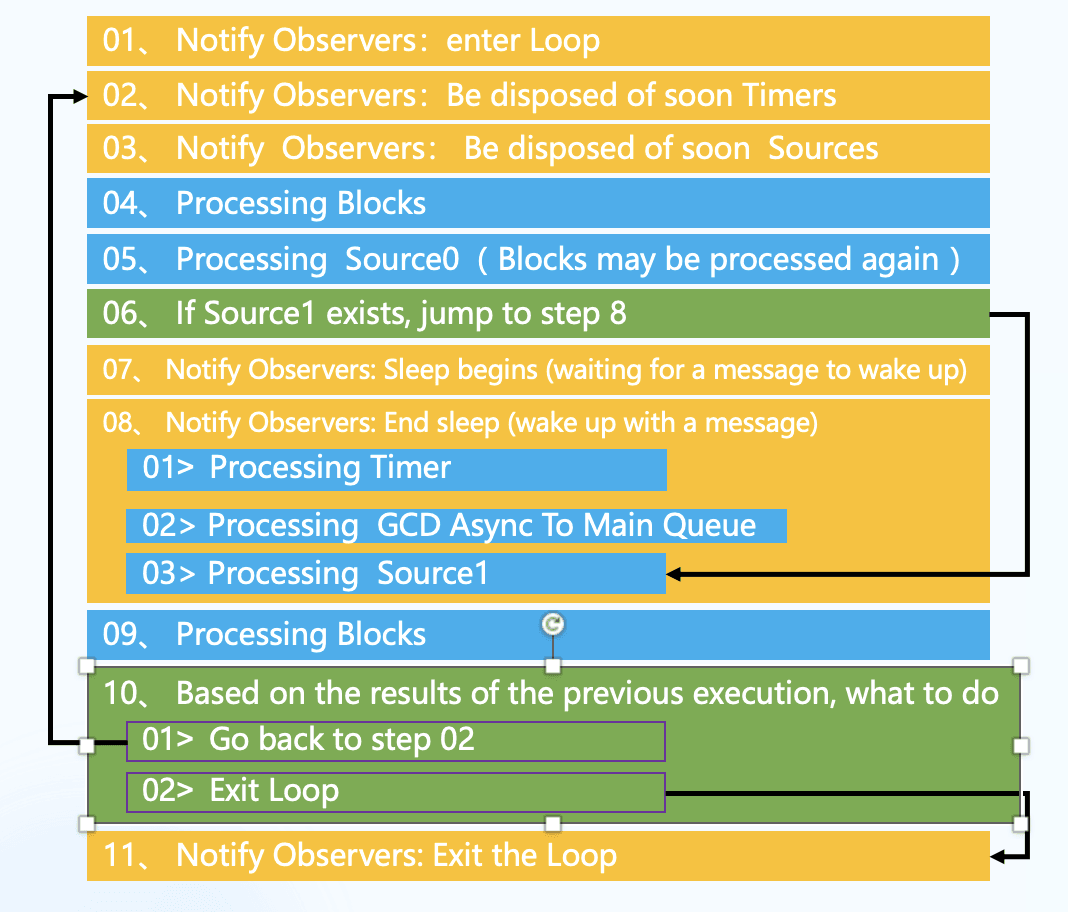
Before starting the project, you need to know the key functions:
- The stuck time is set at 1s
- The stuck time is set at 8s
- The sub-thread that monitors beforeWaiting is event_monitor_queue
- The sub-thread that monitors beforeSources and afterWaiting is fluecy_monitor_queue
- Semaphore statusSemphore:in the sub-thread fluecy_monitor_queue, calls the wait method and uses the timeout to determine whether lag occurs.
- Semaphore eventSemphore: In the sub-thread event_monitor_queue, if a jam occurs, the wait method will be called first to cause the jam. After the main thread is stuck, the signal method will be called, and then the jam information will be output.
- In the sub-thread fluecy_monitor_queue and the sub-thread event_monitor_queue, there is a while loop respectively to monitor changes in the runloop status.
- Distinguish between fake stuck and real stuck.
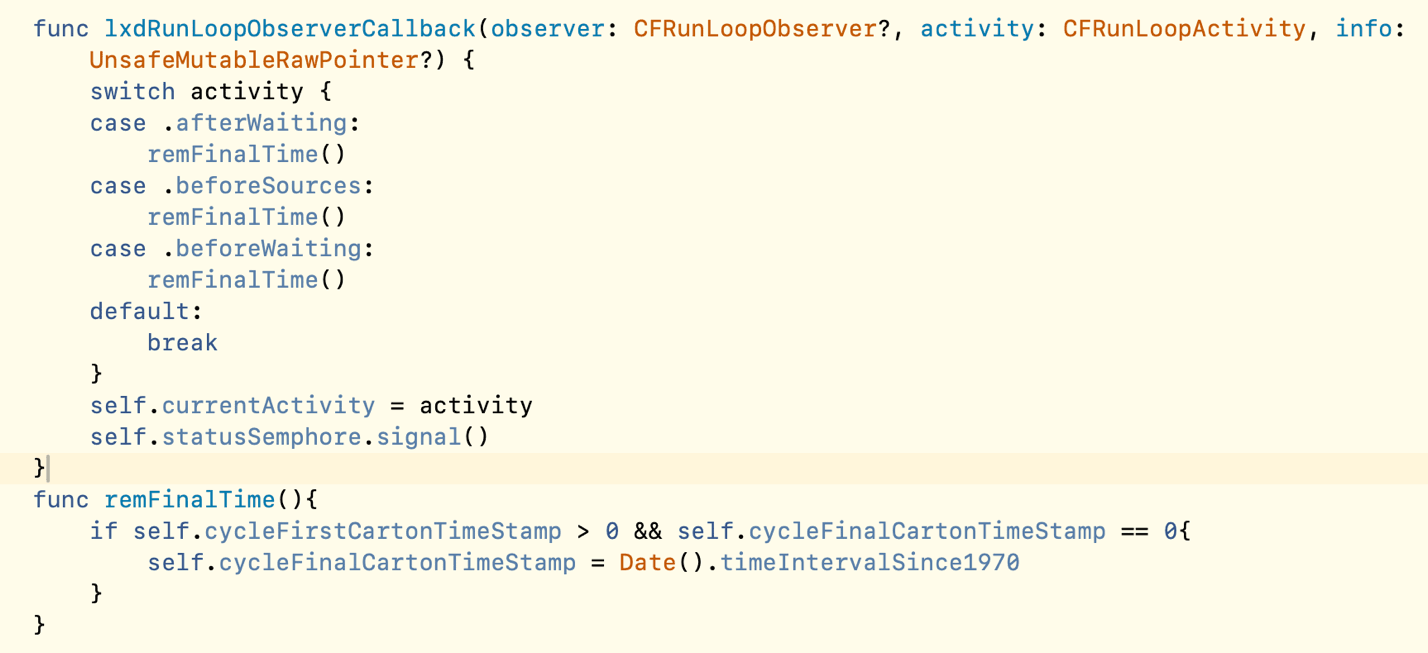
The first step is to listen to the runloop of the main thread. In the callback method, three things are done:
- Record runloop status changes
- Each time the status changes, statusSemphore calls the signal() method to increase the semaphore by 1.
- Record the end time of stuck or stuck in the state beforeWaiting, beforeSources, afterWaiting
The second step is to create a while loop in the sub-thread fluecy_monitor_queue, and use the wait timeout to determine whether the waiting time is 0 (the timeout is 200 * NSEC_PER_MSEC), if it is not 0 and occurs more than 5 times, it is judged that a freeze has occurred, and the start time and stack information of the freeze are recorded. and then sleep for 5 seconds to prevent repeated recording lags.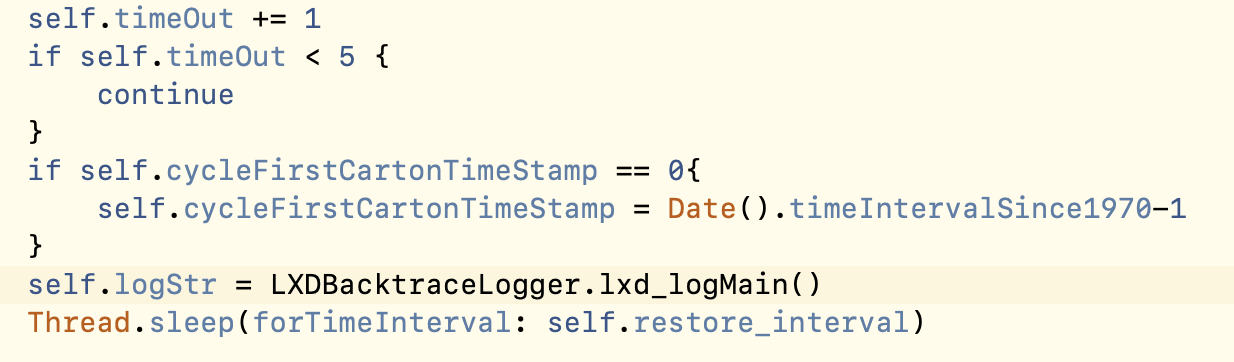
The third step is to create a while loop in the sub-thread event_monitor_queue and use event Semphore completes the thread synchronization function. If a freeze occurs for more than 1 second, the wait method is called first, and then the signal method is called.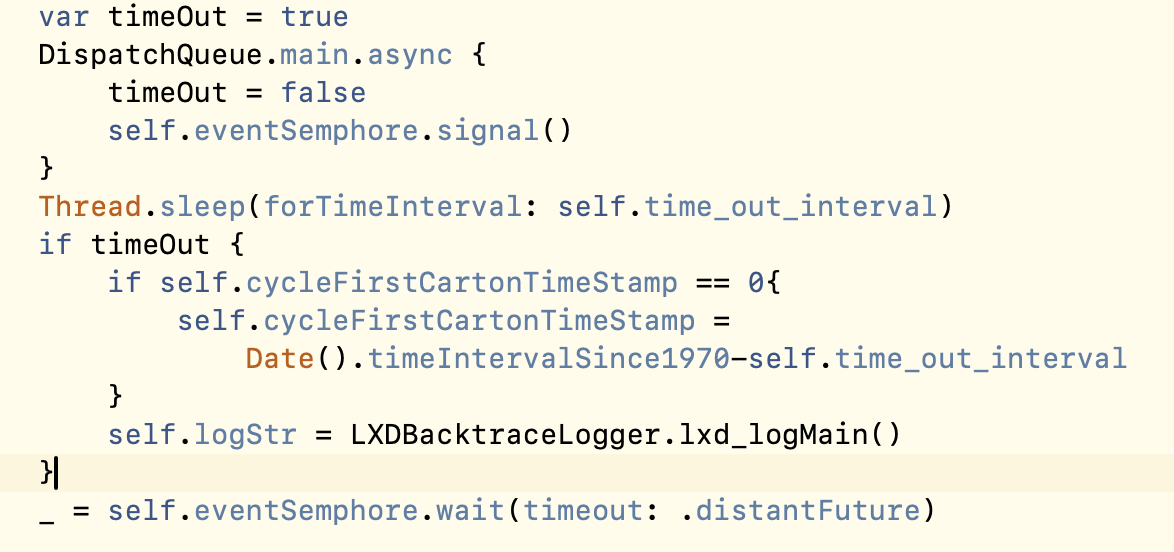
The last step is the timing of outputting the stuck stack information.
Due to lag, the timing of stuck information output is respectively in fluecy_monitor_queue.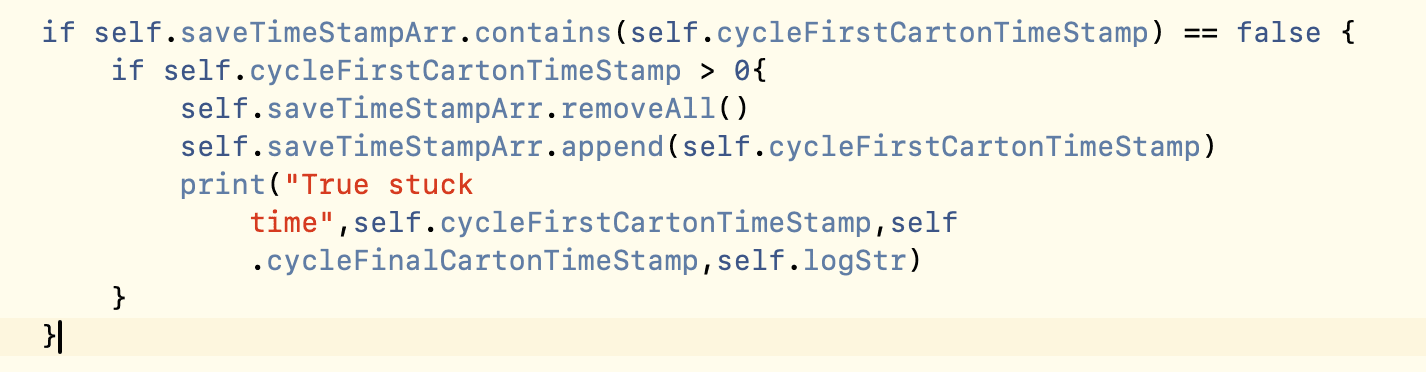
and event_monitor_queue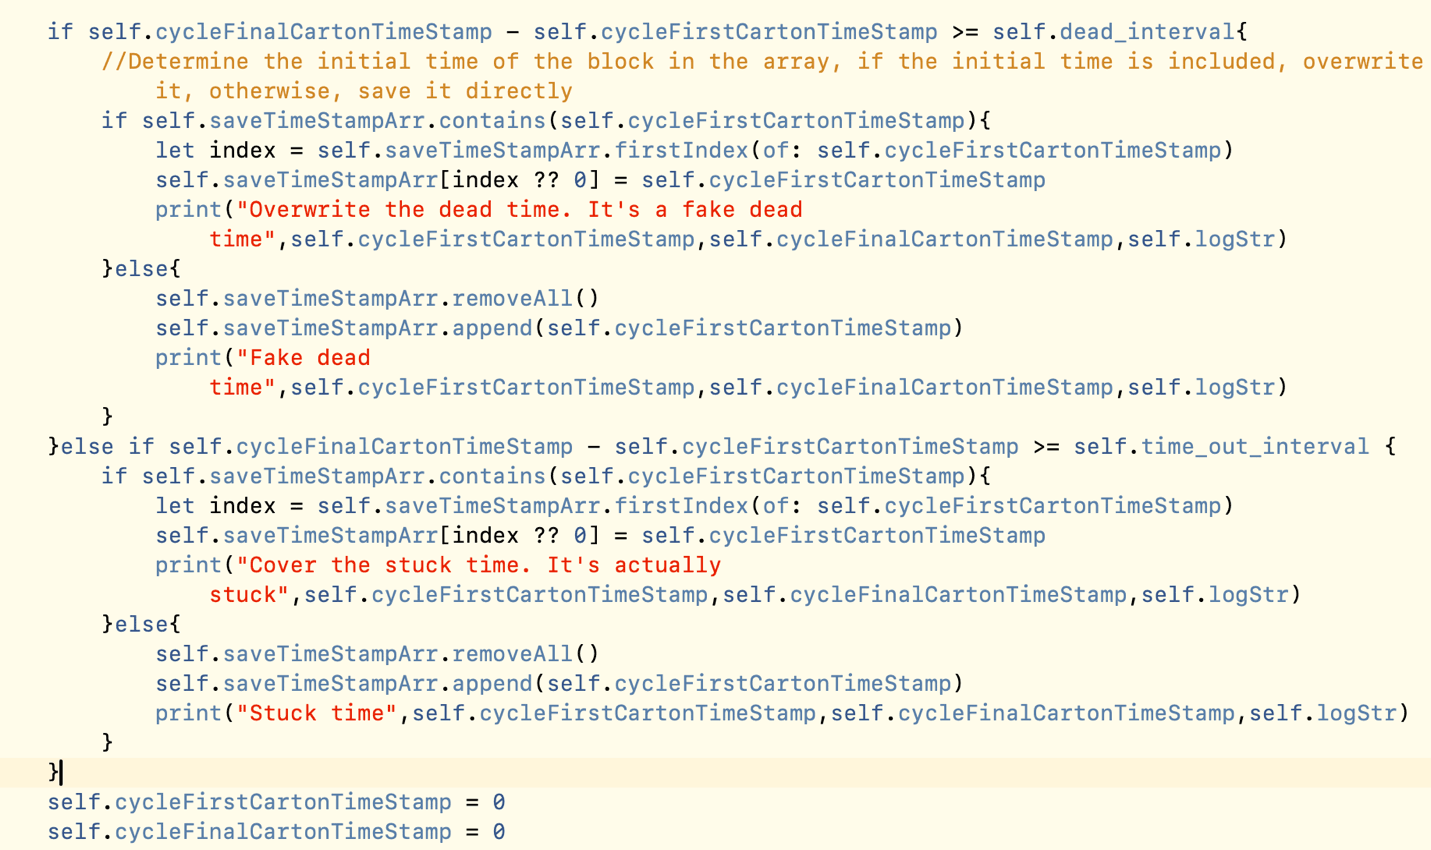
If it is stuck, there are two situations:
- If the stuck time is greater than 1 second and less than or equal to 5 seconds, it will reach the logic that the output in event_monitor_queue is “Stuck time”
- If the stuck time is greater than 5 seconds and less than or equal to 8 seconds, the logic of “True stuck time” in fluecy_monitor_queue will be followed first, and then “Cover the stuck time. It’s actually stuck” in event_monitor_queue will be followed.
If it is stuck, it is divided into real stuck and fake stuck: - If it is really stuck, it will only go to the logic where the output in fluecy_monitor_queue is True stuck time.
- If it is a fake stuck time, it will first go to the logic that the output in fluecy_monitor_queue is True stuck time, and then go to the “Overwrite the dead time. It’s a fake dead time” in event_monitor_queue.
If the current main thread is in the beforetime state, if some app operations are triggered, it may be “Fake dead” of event_monitor_queue. time”, but it may not come to.
This is the solution I have thought of so far. If there are other good solutions, please feel free to share them.