openai.ChatCompletion.create( model="gpt-3.5-turbo", messages=[ {"role": "system", "content": "You are a helpful assistant."}, {"role": "user", "content": "Who won the world series in 2020?"}, {"role": "assistant", "content": "The Los Angeles Dodgers won the World Series in 2020."}, {"role": "user", "content": "Where was it played?"} ] ) { "choices": [ { "finish_reason": "stop", "index": 0, "message": { "content": "The 2020 World Series was played in Texas at Globe Life Field in Arlington.", "role": "assistant" } } ], "created": 1677664795, "id": "chatcmpl-7QyqpwdfhqwajicIEznoc6Q47XAyW", "model": "gpt-3.5-turbo-0613", "object": "chat.completion", "usage": { "completion_tokens": 17, "prompt_tokens": 57, "total_tokens": 74 } } response['choices'][0]['message']['content']
response = openai.Image.create_edit( image=open("sunlit_lounge.png", "rb"), mask=open("mask.png", "rb"), prompt="A sunlit indoor lounge area with a pool containing a flamingo", n=1, size="1024x1024" ) image_url = response['data'][0]['url']
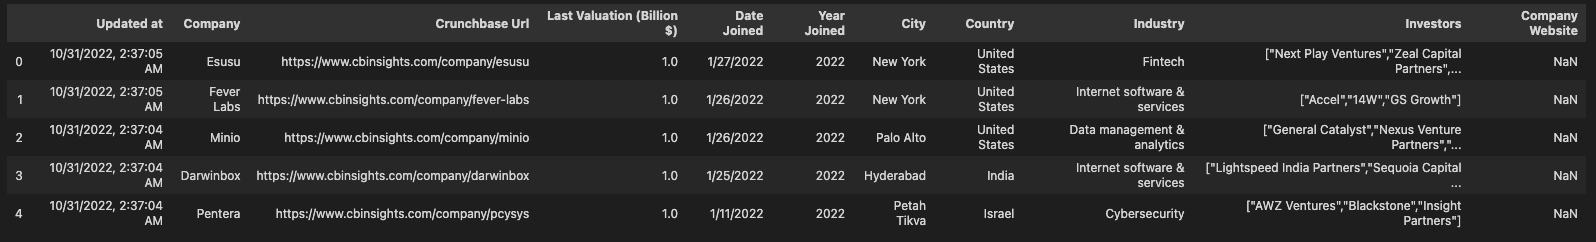
defsummary(company,crunchbase_url,city,country,industry,investor_list): investors = 'The investors in the company are' for investor in ast.literal_eval(investor_list): investors += f" {investor}, "
text = f"{company} has headquarters in {city} in {country} and is in the field of {industry}. {investors}. You can find more information at {crunchbase_url}"
return text df['summary'] = df.apply(lambda df: summary(df['Company'],df['Crunchbase Url'],df['City'],df['Country'],df['Industry'],df['Investors']),axis=1) Esusu has headquarters in New York in United States andisin the field of Fintech. The investors in the company are Next Play Ventures, Zeal Capital Partners, SoftBank Group, . You can find more information at https://www.cbinsights.com/company/esusu'
Remember to calculate tokens first
1 2 3 4 5 6 7 8 9
defget_embedding(text): # Note how this function assumes you already set your Open AI key! result = openai.Embedding.create( model='text-embedding-ada-002', input=text ) return result["data"][0]["embedding"]
prompt = "What does the company Momenta do and who invested in it?" prompt_embedding = get_embedding(prompt) # There are other services/programs for larger amount of vectors # Take a look at vector search engines like Pinecone or Weaviate defvector_similarity(vec1, vec2): """ Returns the similarity between two vectors. Because OpenAI Embeddings are normalized to length 1, the cosine similarity is the same as the dot product. """ array_vec1 = np.array(ast.literal_eval(vec1)) array_vec2 = np.array(vec2) return np.dot(array_vec1, array_vec2)
# Could also use sort_values() with ascending=False, but nlargest should be more performant print(df.nlargest(1,'prompt_similarity').iloc[0]['summary'])
defvector_similarity(vec1, vec2): """ Returns the similarity between two vectors. Because OpenAI Embeddings are normalized to length 1, the cosine similarity is the same as the dot product. """ array_vec1 = np.array(ast.literal_eval(vec1)) array_vec2 = np.array(vec2) return np.dot(array_vec1, array_vec2)
defembed_prompt_lookup(): # initial question question = input("What question do you have about a Unicorn company? ") # Get embedding prompt_embedding = get_embedding(question) # Get prompt similarity with embeddings # Note how this will overwrite the prompt similarity column each time! df["prompt_similarity"] = df['embedding'].apply(lambda vector: vector_similarity(vector, prompt_embedding))
# get most similar summary summary = df.nlargest(1,'prompt_similarity').iloc[0]['summary'] #summary = df.sort_values("prompt_similarity", ascending=False).head()
prompt = f"""Only answer the question below if you have 100% certainty of the facts, use the context below to answer. Here is some context: {summary} Q: {question} A:"""
# Note: you need to be using OpenAI Python v0.27.0 for the code below to work import openai audio_file= open("/path/to/file/audio.mp3", "rb") transcript = openai.Audio.transcribe("whisper-1", audio_file) { "text": "Imagine the wildest idea that you've ever had, and you're curious about how it might scale to something that's a 100, a 1,000 times bigger. .... }
How to calculate TOKENS
WHY CALCULATE
It is important to evaluate your cost before calling, especially for TEXT EMBEDDING & FINE TUNING. NOTE HERE: Different Models use Different Encodings! tiktoken supports 3 different encodings for OpenAI models: “gpt2” for most gpt-3 models “p50k_base” for code models, and Davinci models, like “text-davinci-003” “cl100k_base” for text-embedding-ada-002
defnum_tokens_from_string(string, encoding_name): """Returns the number of tokens in a text string.""" encoding = tiktoken.get_encoding(encoding_name) num_tokens = len(encoding.encode(string)) return num_tokens num_tokens_from_string(df['summary'][0],encoding_name='cl100k_base') df['token_count'].sum() * 0.0004 / 1000
A cute example from me: Auto Generated QUIZ
Stocks Chat Bot
Use chat GPT to analyze a stock
economic moats, how the company cam scale?
SWOT ANALISIS
a fact based, data-driven evaluation of a firm’s strengths,weaknesses,opportunities and threats.
1
prompt:write me a swot analisis on TESLA
summarize earning calls
Earning Calls are a key source of valuable information for investors. Earning Calls: discuss recent performance,discuss the outlook for the industry, answers questions from analysts and so on.
1
prompt: give me top 15 points of this: "web link"
Evaluate ESG ESG: environment, social, government
1
prompt:evaluate tesla's ESG credentials
generate codes to backtest Buy and Sell Signals
Backtesting allows a trader to simulate a trading strategy. a buy signal is an event or condition selcted by a trader or investor to purchase a sell signal is anything that alerts a trader to sell an asset The RSI Indicator is a tool that helps people who buy & sell stocks or other things figure out if something costs too much or too little. background:
1
Low RSI levels, below 30, generate buy signals and indicate an oversold or undervalued condition. High RSI levels, above 70, generate sell signals and suggest that a security is overbought or overvalued. A reading of 50 denotes a neutral level or balance between bullish and bearish positions.
1 2
prompt: write me code to see how tesla's stock price performs one month after its RSI dips below 30.
also, key risks;
1
prompt: identify the key risks of TESLA stock
Coding:
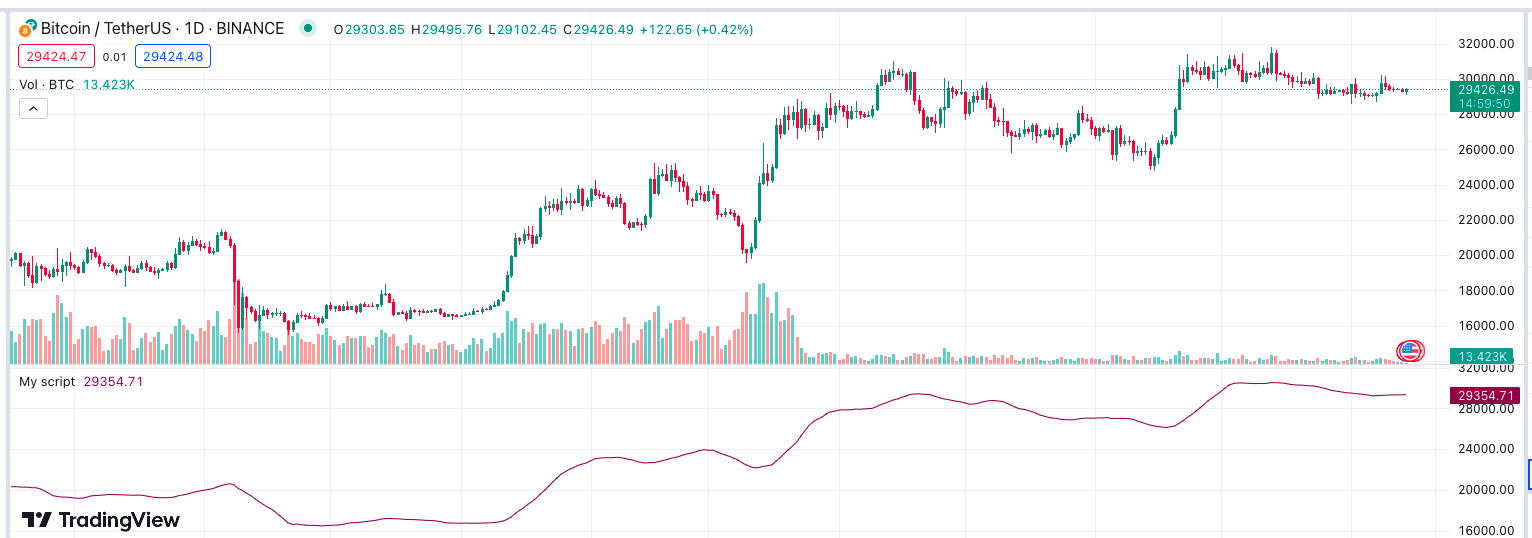
Simple Moving Average(SMA)
the avearage closing price of a given security over a specific number of days.
1
2
3
4
5
6
7
8
9
10
11
prompt:generate pine script code to create a simple moving average of the closing price with a period of 14 days
red line(actually maroon) in the bottom is what we add!
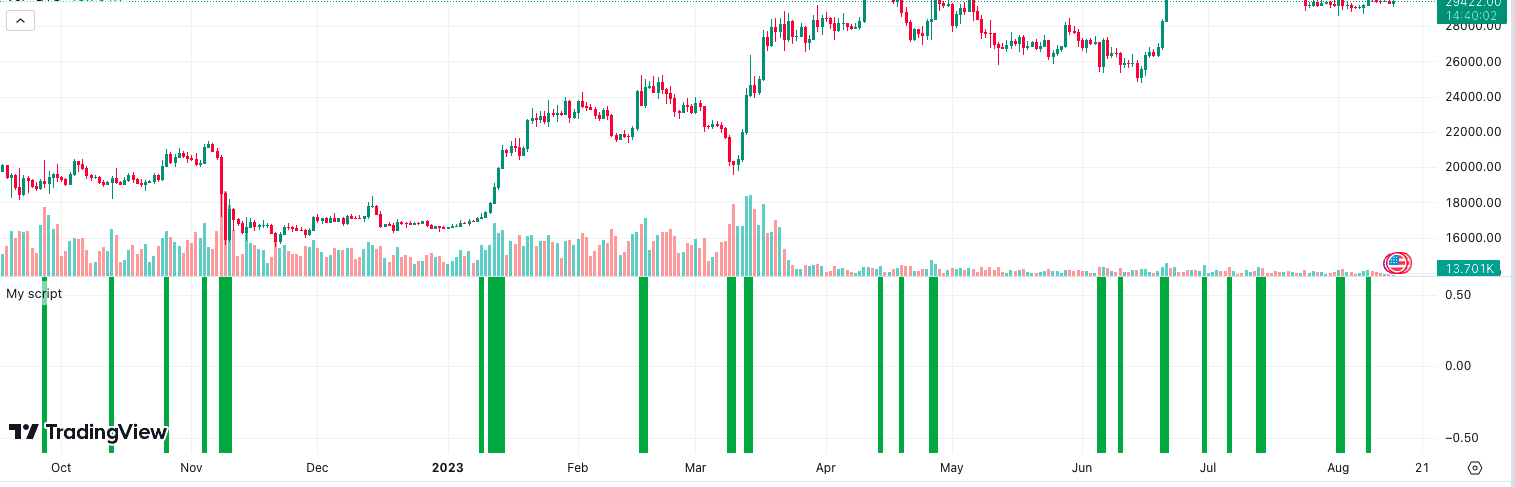
volume
1 2 3 4 5 6 7 8 9
prompt: generate pine script code that turns the background color green when volume is50% or greater above the volume move average with a period of 14 days. //@version=5 indicator("My script") length = 14 vol_ma = ta.sma(volume, length)
condition = volume >= 1.5 * vol_ma
bgcolor(condition ? color.green : na)
automate your trading strategy with chatGPT
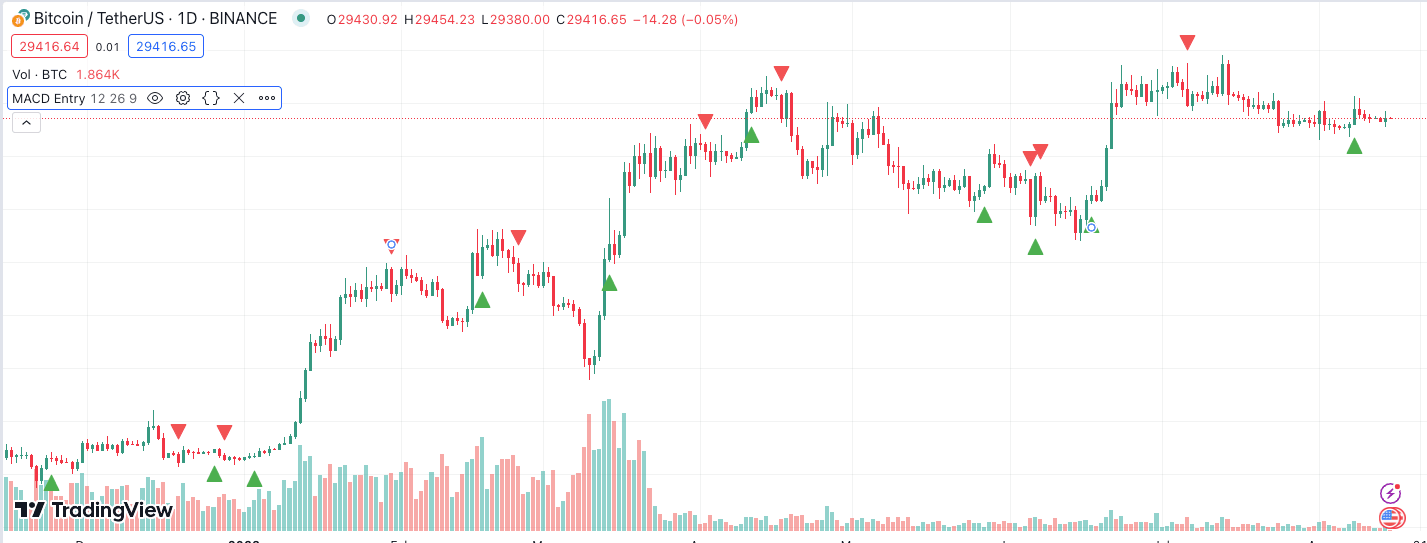
Entry and Exit Strategy
1
prompt: generate pine script code to enter on a macd crossover.write in version 5.
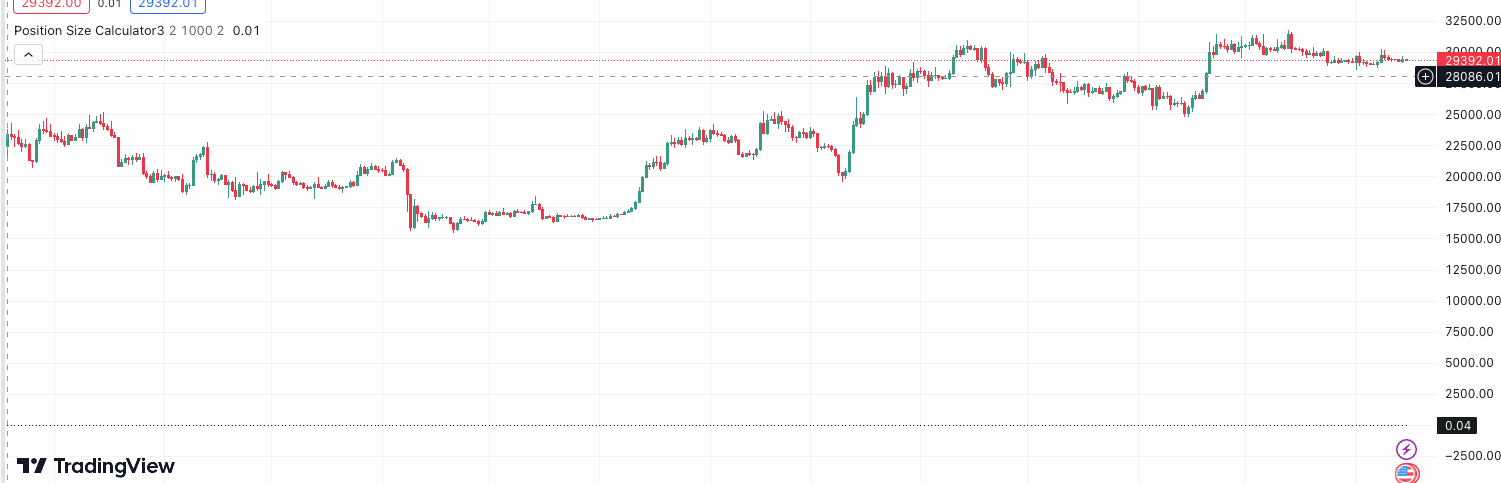
refers to the number of units invested in a particular security by an investor or trader. an investor’s account size & risk tolerance should be taken into account when determining appropriate position sizing.
1
2
prompt:generate pine script code to determine position size based on a risk tolerance of 2% per trade, an account size of $1000,and a risk to reward ratio of 2 to 1. write in version 5
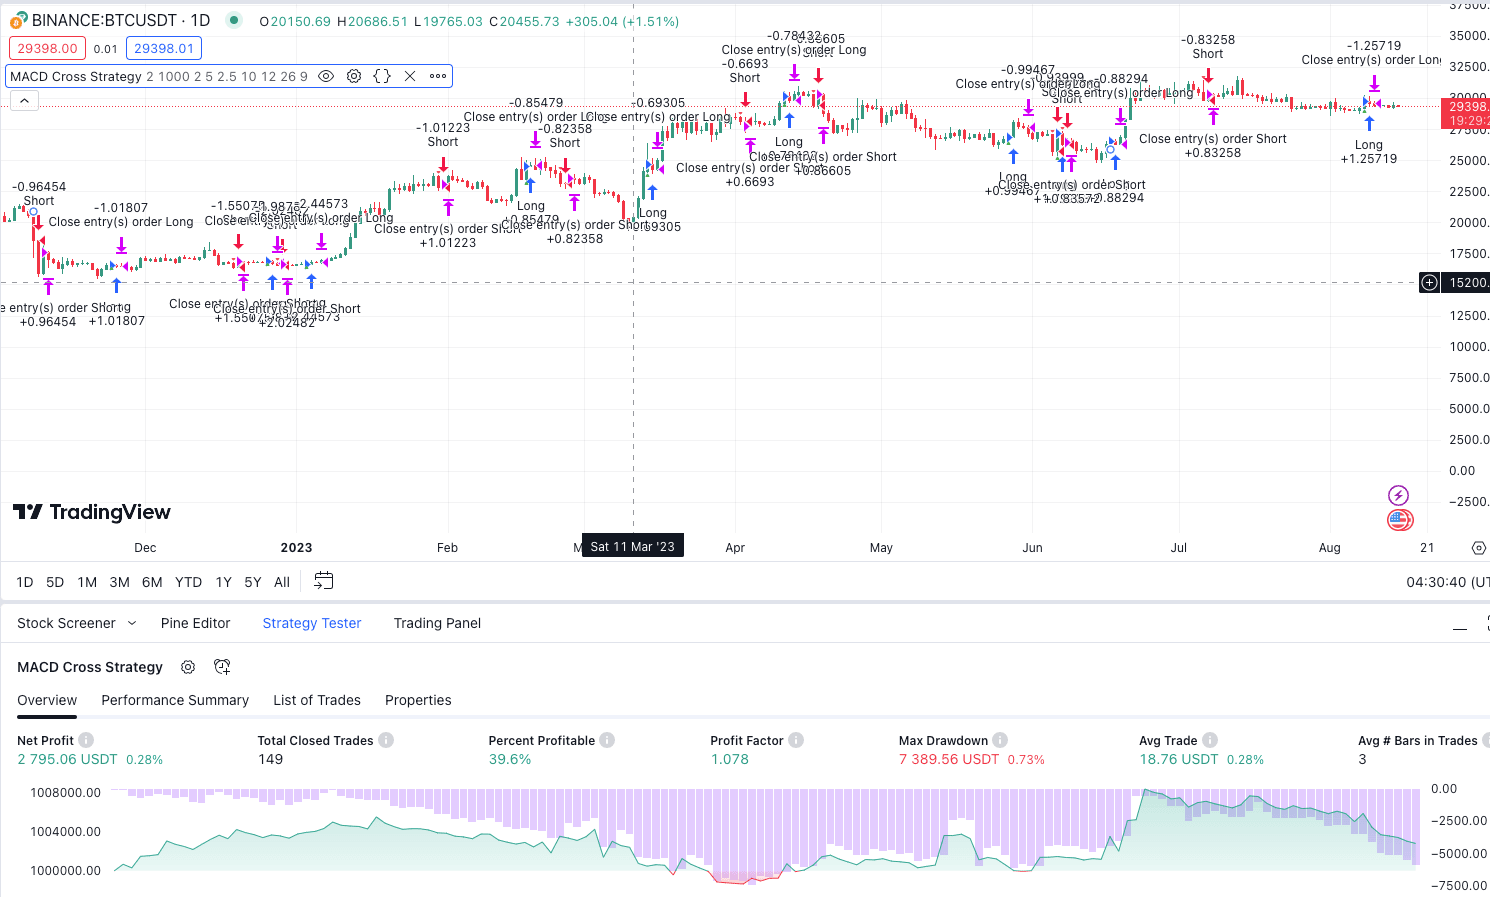
prompt: generate a pine script strategy backtest that enters into trades on MACD crosses,determines position size based on a risk tolerance of 2% per trade, an account size of $1000, and a risk to reward ratio of 2:1,uses a 5% stop loss order and a 2.5% trailing stop loss order with a take profit order of 10%. strategy("MACD Cross Strategy", overlay = true)
// Inputs riskTolerance = input(2, title = "Risk Tolerance (%)") accountSize = input(1000, title = "Account Size ($)") riskRewardRatio = input(2, title = "Risk to Reward Ratio") stopLossPercentage = input(5, title = "Stop Loss (%)") trailingStopPercentage = input(2.5, title = "Trailing Stop (%)") takeProfitPercentage = input(10, title = "Take Profit (%)") fastLength = input(12, title = "Fast Length") slowLength = input(26, title = "Slow Length") signalLength = input(9, title = "Signal Length")
// Calculate maximum risk amount per trade riskAmount = (riskTolerance / 100) * accountSize
// Strategy orders if (longCondition) strategy.entry("Long", strategy.long, qty = positionSize)
if (shortCondition) strategy.entry("Short", strategy.short, qty = positionSize)
if (longExitCondition) strategy.close("Long")
if (shortExitCondition) strategy.close("Short")
// Plot signals on chart plotshape(series = longCondition, style = shape.triangleup, location = location.belowbar, color = color.green) plotshape(series = shortCondition, style = shape.triangledown, location = location.abovebar, color = color.red)
build a stock market & day trading bot using chatGPT
VWAP What is VWAP? volume-weighted average price a measure, used in technical analysis, of a security’s average price over a trading period. It’s a trading benchmark that represents the average price a security has traded at throughout the day, based on both volume and price. VWAP is important because it provides traders with pricing insight into both the trend and value of a security. VOLUME indicator definition: a technical analysis tool which helps traders evaluate the strength of the current market trend by measuring the cumulative volume over a specified period of time. fomula: volume strength = volume of a stock/period in time traders look to volume to determine liquidity go to trading view—indicator—search vwap (by neolao),—look at the source code—in version 3, out dated
1
prompt: use the code provided to create a strategy in pinescript to buy when the prices cross over vwap, and short when the price crossed below vwap.
// There are five steps in calculating VWAP: // // 1. Calculate the Typical Price for the period. [(High + Low + Close)/3)] // 2. Multiply the Typical Price by the period Volume (Typical Price x Volume) // 3. Create a Cumulative Total of Typical Price. Cumulative(Typical Price x Volume) // 4. Create a Cumulative Total of Volume. Cumulative(Volume) // 5. Divide the Cumulative Totals. // // VWAP = Cumulative(Typical Price x Volume) / Cumulative(Volume)